nQ Medical

Led UX Strategy for Remote Neurological Care.

90% Real-Time Tremor Analysis
60% Engagement Boost
75% Primary Keyboard Usage

90% Real-Time Tremor Analysis
60% Engagement Boost
75% Primary Keyboard Usage

  • Driving Adoption, Trust & Clinical Insight through Service-Centered Design

  • Designed for elderly patients with Parkinson’s

  • Led cross-functional team of 5 (research, design, engineering, clinicians)

nQ Medical

Led UX Strategy for Remote Neurological Care.

90% Real-Time
Tremor Analysis
60% Engagement Boost
75% Primary Keyboard Usage

  • Driving Adoption, Trust & Clinical Insight through Service-Centered Design

  • Designed for elderly patients with Parkinson’s

  • Led cross-functional team of 5 (research, design, engineering, clinicians)

nQ Medical

Led UX Strategy for Remote Neurological Care.

90% Real-Time Tremor Analysis
60% Engagement Boost
75% Primary Keyboard Usage

  • Driving Adoption, Trust & Clinical Insight through Service-Centered Design

  • Designed for elderly patients with Parkinson’s

  • Led cross-functional team of 5 (research, design, engineering, clinicians)

Cover Image
Cover Image
Cover Image
Cover Image

01. Overview

Remote healthcare is vital for patients with neurodegenerative conditions, but it often fails those who need it most.
For people living with Parkinson’s, managing care through digital platforms can be overwhelming, inaccessible, and lacking empathy. Clinicians, in turn, struggle with incomplete data and time-consuming dashboards.

nQ Medical sought to change that.
Their passive monitoring solution transforms daily keyboard activity into tremor detection signals, turning routine typing into a window into neurological health. But to succeed, this innovation needed a radically human-centered experience.

ROLE:

UI Designer, Project Manager

DURATION:

12 Weeks

TOOLS:

Adobe XD, Illustrator, Photoshop

INDUSTRY

Healthcare, Marketing

ROLE:

Lead UX Designer, Service Design,
Project Manager

DURATION:

12 Weeks (2 Sprints + Clinical Pilot)

TOOLS:

Figma, Miro, Dovetail, Maze, Adobe XD

INDUSTRY

Digital Health, Remote Monitoring

02. Design Process

  1. DISCOVER:

Can be used to explore the problem area, focus on an specific issue or crowdsource insights about a particular topic.

  1. DEFINE:

Can be used to validate problem definitions and test the assumptions underlaying those definitions

  1. DEVELOP:

Can be used to co-create ideas, validate design hypothesis and build prototypes. Here is suggested to conduct separate workshops

  1. DELIVER:

Can be used to validate and test prototypes (comprising UI & UX)

Problem and outcome
Problem and outcome
Problem and outcome
Problem and outcome

03. Research

To ensure an experience that works across touchpoints, I conducted multi-perspective research involving:

  • Patients with Parkinson’s: Explored digital behavior, accessibility needs, and emotional barriers to tech-based care.

  • Caregivers: Uncovered their role in digital onboarding, troubleshooting, and data interpretation.

  • Clinicians: Identified dashboard pain points, gaps in trend visibility, and EMR integration issues.

We used interviews, shadowing, journey mapping, and environment/context audits to understand where the service failed or succeeded across the entire remote care experience and existing app to be able to redesign the whole experience.

  • Through user research and interviews, I examined how Parkinson’s patients interact with digital keyboards. This involved studying typing patterns, gathering insights from healthcare professionals, and testing adaptive designs to enhance accessibility.
    My key findings include:

    • Early DetectionTyping patterns (speed, accuracy, rhythm) help identify motor deficits, aiding in Parkinson’s diagnosis and tracking.

    • Disease MonitoringContinuous keyboard analysis provides real-time insights into symptom progression and medication effectiveness.

    • Improved AccessibilityAddressing challenges like tremors and stiffness led to the development of an adaptive, user-friendly keyboard.

    • Data-Driven CareThe non-intrusive tool empowers patients and healthcare providers with real-time insights for better disease management.

04. Key Cross-Touchpoint

Early Detection Opportunity
Typing speed and rhythm offered critical insight for identifying motor symptoms earlier than traditional clinical visits.

  • Onboarding Breakdown
    Patients felt overwhelmed during setup. Many dropped off due to lack of guidance and motor-related navigation struggles.

  • Caregiver Reliance
    50% of patients required caregiver support for setup and ongoing use, but the app didn’t consider this dual-user model.

  • Clinician Fatigue
    Dashboards were “too busy.” They wanted quick symptom summaries and color-coded alerts, not raw data.

  • Trust Gaps
    Several users questioned where their data went. We added inline microcopy and visual trust signals during onboarding.

  • Through user research and interviews, I examined how Parkinson’s patients interact with digital keyboards. This involved studying typing patterns, gathering insights from healthcare professionals, and testing adaptive designs to enhance accessibility.
    My key findings include:

    • Early DetectionTyping patterns (speed, accuracy, rhythm) help identify motor deficits, aiding in Parkinson’s diagnosis and tracking.

    • Disease MonitoringContinuous keyboard analysis provides real-time insights into symptom progression and medication effectiveness.

    • Improved AccessibilityAddressing challenges like tremors and stiffness led to the development of an adaptive, user-friendly keyboard.

    • Data-Driven CareThe non-intrusive tool empowers patients and healthcare providers with real-time insights for better disease management.

research image
research image
research image
research image

05. Service Landscape Scan: Assistive Technologies for Parkinson’s Monitoring

05. Service Landscape Scan: Assistive Technologies for Parkinson’s Monitoring

To understand how similar tools support Parkinson’s patients, I analyzed both their technical approaches and the surrounding service delivery experience—onboarding, data feedback, caregiver support, and trust.

This landscape scan helped identify critical gaps in the user journey that nQ Medical could address.

competitive analysis

Key Gaps Identified:

  • No caregiver-mode support

  • No progressive onboarding or voice-based instructions

  • Weak patient feedback loops (data goes in, but users don’t see the “why it matters”)

  • Minimal visual trust signals around privacy or data security

06. Application Map

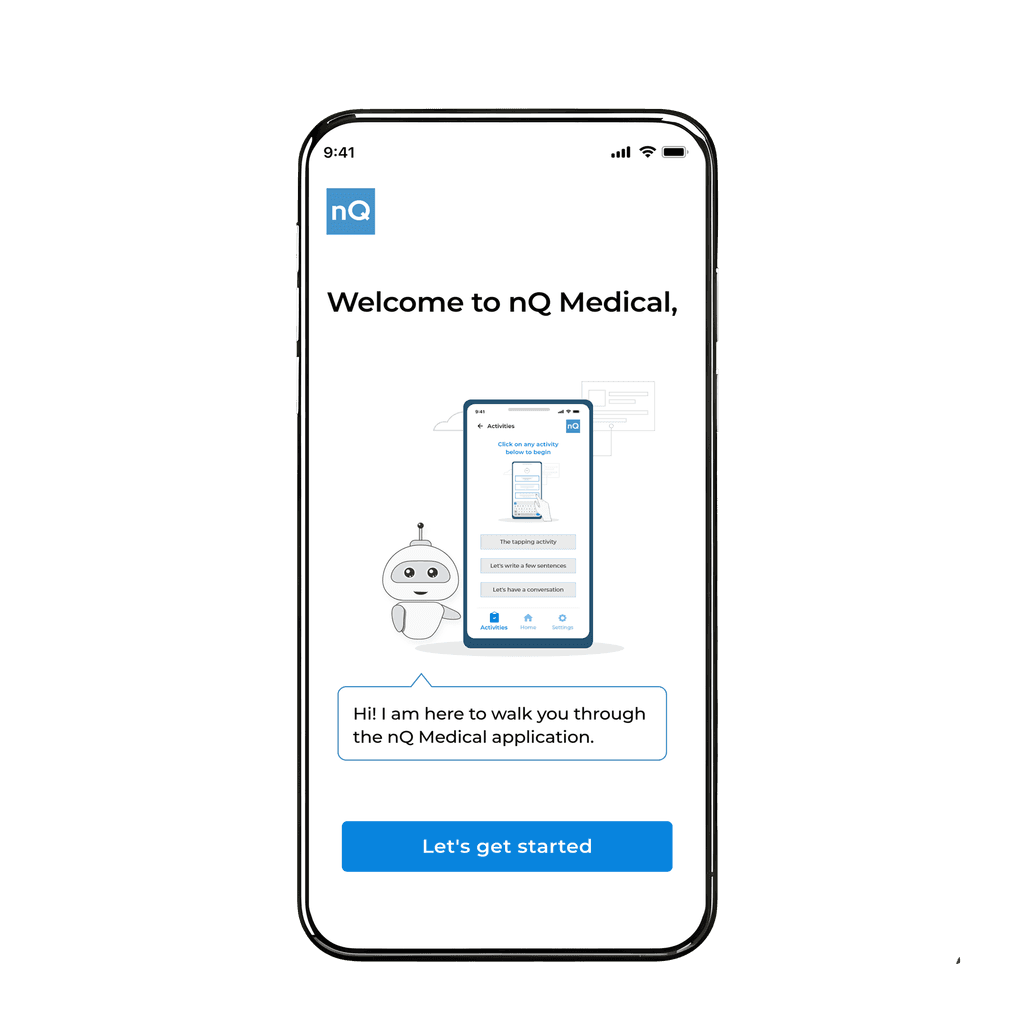
This structured application map was created based on stakeholder interviews, accessibility research, and onboarding pain points identified in user testing. It visualizes the end-to-end app journey—from account creation to typing activities—and incorporates trust checkpoints, accessibility setup flows, and support channels that are essential for a public-facing digital service.

application mapping
application mapping
application mapping
application mapping

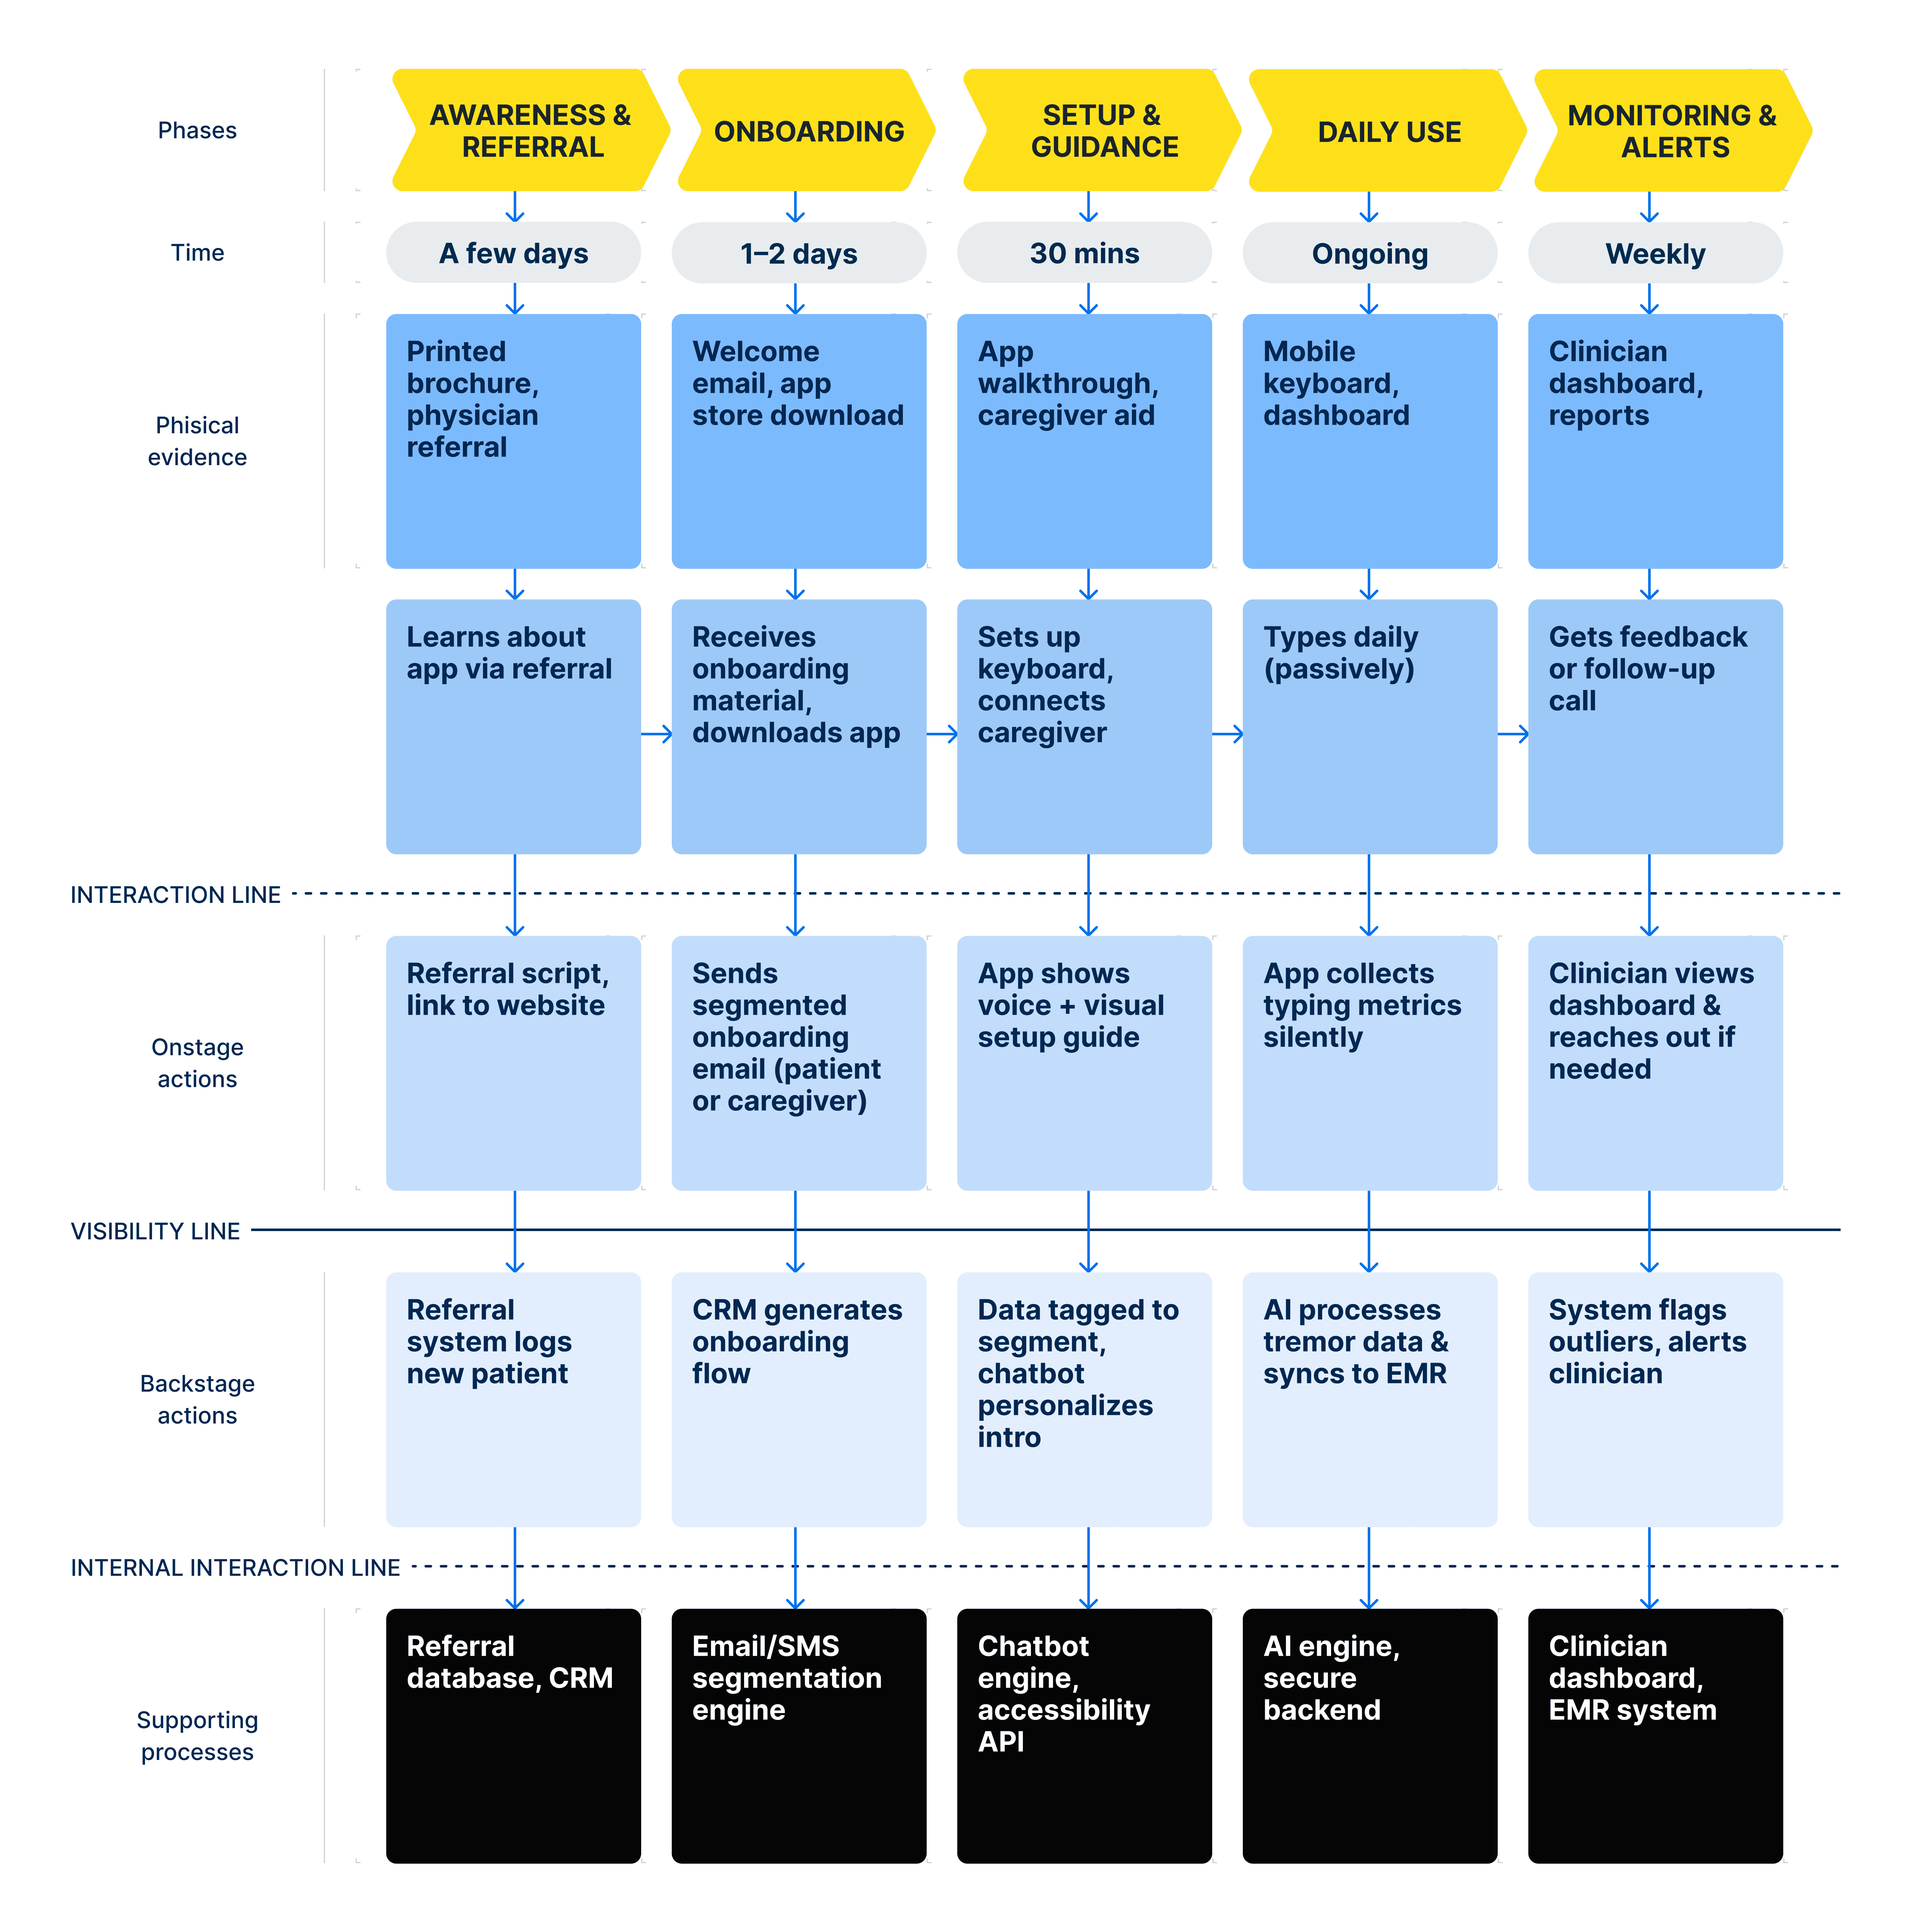
07. Service Blueprint

This blueprint shows how patients, caregivers, and clinicians interact with the nQ Medical service—from referral to ongoing care. It maps each step of the journey, including what users see, what happens behind the scenes, and the systems that support it. The goal is to ensure a smooth, accessible, and connected remote care experience.

application mapping
application mapping
application mapping
application mapping

08. The Designs

personalized experience

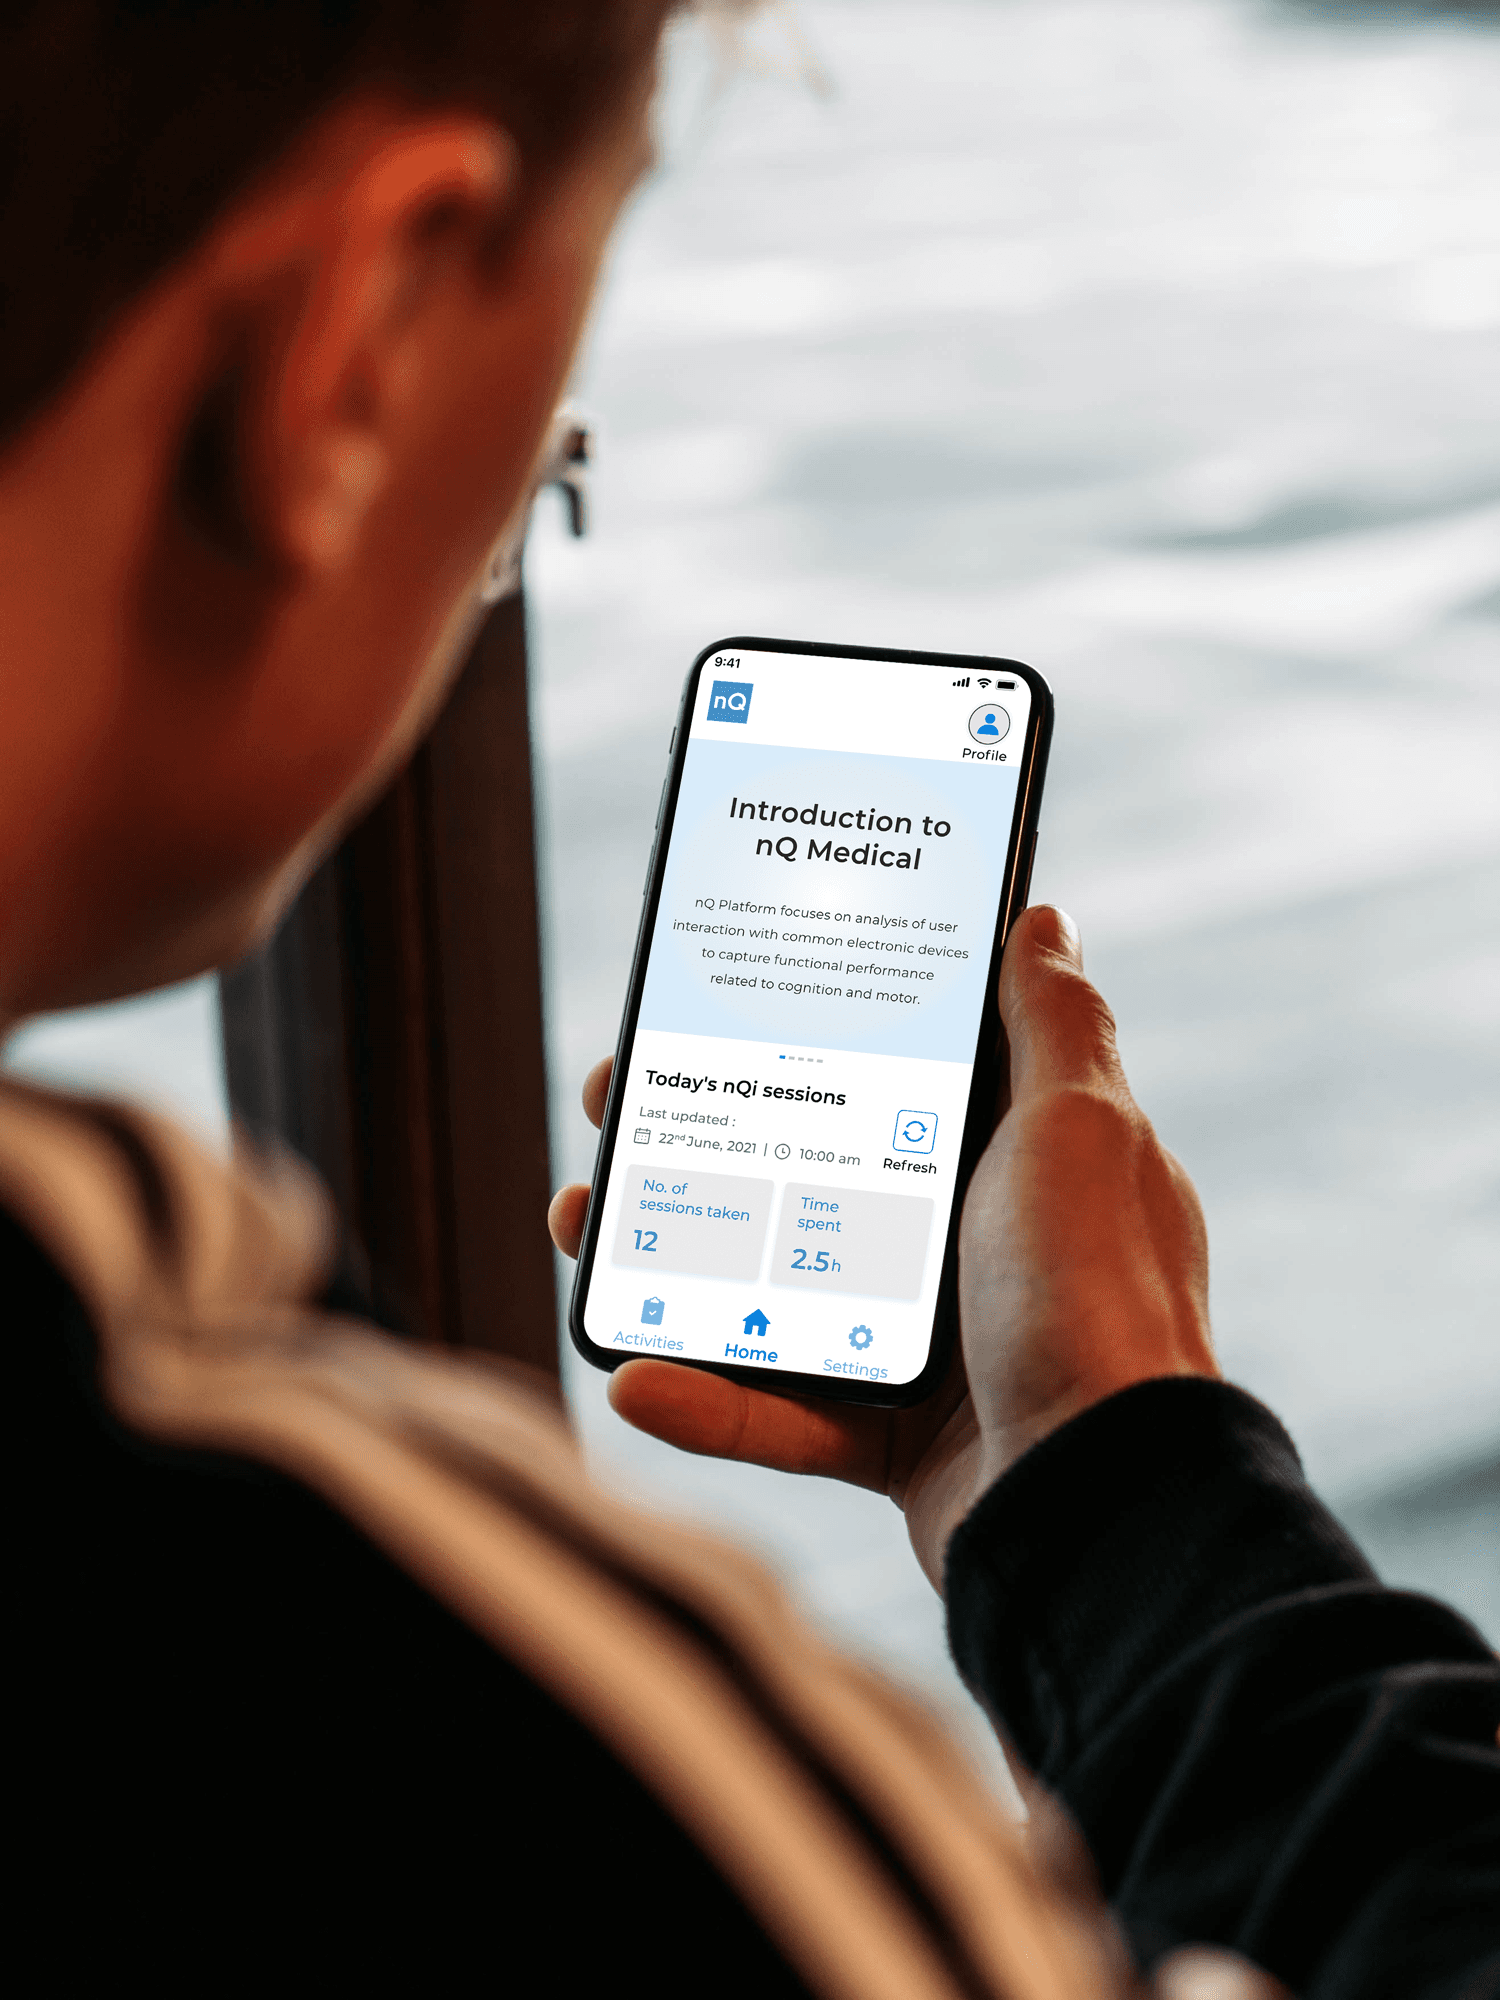
Personalized Home & Activity Experience

  • The nQ Medical app makes it easy for users to track their activity sessions. The Home Screen gives a quick view of session count and time spent.

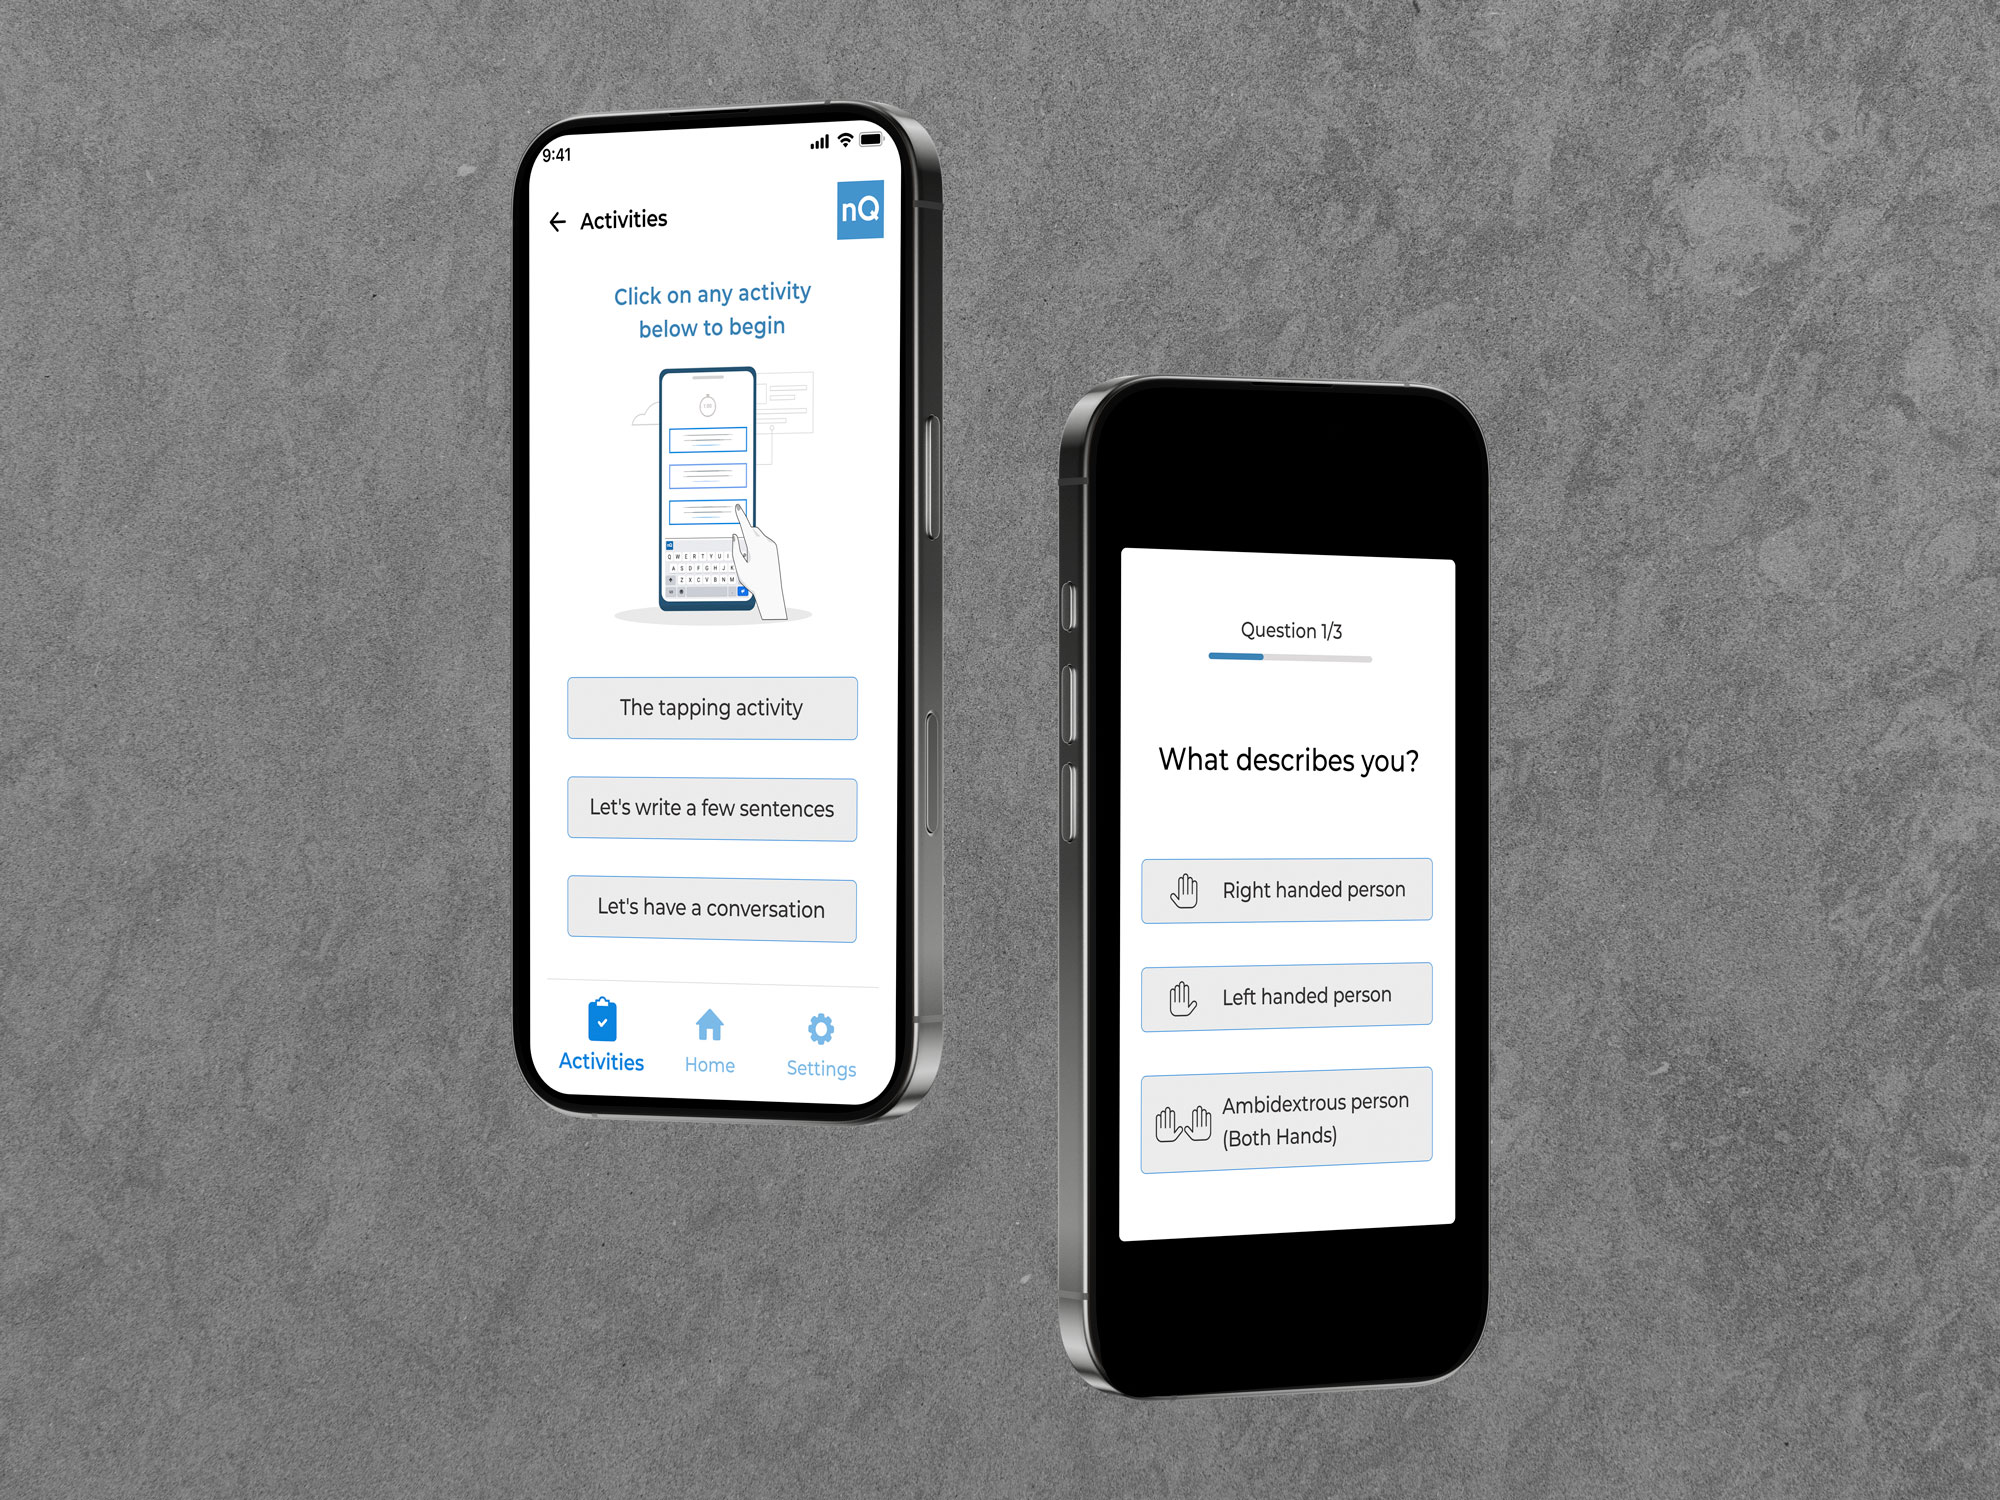
  • The Activities Screen lets users choose tasks like tapping, typing sentences, or conversation-style writing—designed specifically for neurological assessment.

  • This clean and accessible layout ensures ease of use for patients with motor challenges and supports real-time monitoring for clinicians.

Smart Setup for Individual Typing Patterns

Before use, users answer a few questions to personalize the app.
This setup helps identify:

  • Typing style (one or both hands)

  • Motor strength or difficulty

  • Preferred interaction type

This enables more accurate tracking, symptom detection, and keyboard adaptation for Parkinson’s patients.

optimizing typing
optimizing typing
optimizing typing
optimizing typing
Accessing motor and cognitive function

Typing Tasks That Measure Function

Users complete 3 simple tasks:

  1. Finger Tapping – checks motor coordination and tremors

  2. Paragraph Typing – tracks speed and errors

  3. Conversational Typing – evaluates communication style and rhythm

These tasks help detect early signs of cognitive or motor decline and support personalized care planning.

09. Prototype videos for better understanding of the flow

11. Final Survey

TWe conducted a usability survey with 5 participants, including Parkinson’s patients, caregivers, and healthcare professionals, to evaluate the nQ Medical Keyboard's ease of use, effectiveness, and overall value.

1. Ease of Use
Average Rating: 4.6 / 5

  • 88% found the keyboard easy to use

  • 92% said setup instructions were clear and simple

  • 🗣 “The interface is intuitive. A quick video guide could make it even easier.”

2. Effectiveness of Insights
Average Rating: 4.4 / 5

  • 82% found the insights helpful in tracking motor symptoms

  • 87% said the typing data reflected real challenges accurately

  • 🩺 Clinicians suggested a trend comparison tool for tracking progress

3. Impact on Quality of Life
Perceived Improvement:

  • 78% of patients and caregivers said the insights helped them better understand symptoms

  • 80% of clinicians believed it could enhance care planning and treatment tracking

4. Overall Satisfaction
Average Rating: 4.5 / 5

  • 84% were satisfied with their experience

  • 80% would recommend the tool to others

conclusion
conclusion
conclusion
conclusion

Thank you for reading!

Thank you for reading!